Putting it all together:
I've been trading for so many years and I still can't
find the winning setup without some risk of losing the amount of money
I'm willing to risk or being stopped out.
The only 100% certainty is that even the best looking setup could and will fail at times. Any price affecting event can happen at any time.
You
need to always risk the same amount of money on every trade, combined
with the need to find trades that will reward you three times to one the
risk amount that you are willing to lose, because you can have two
trades being stopped out and if the third one hits three times reward
target, you end up making one risk amount of money, even with two losing
trades.
Basically always try to find the higher odds trade 3 to 1 or greater R/R. And protect yourself with a solid stop underneath in case your trade/ investment moves in the opposite direction that was intended.
Lets go in more detail about how to take advantage of the ebb and flow of price interacting with everything basically, from different time frames, some self fulfilling indicators and even seasonality of the year.
Price is what most of us try to follow and future price is what most of us try to guess to capitalize on it, if we bet on such prediction and we're right we capitalize.
One of the best known soundbites in the trading and investing culture is: The trend is your friend, and it is. So lets get more familiar with this very important friend.
Another soundbite: Professionals buy low and sell high.
This lesson will show you where to buy low because the higher price gets inside the wave higher and the longer it takes for you to enter, the lower your reward and the higher the risk of losing.
Look at a chart of any stock and for the most part you'll see price trending higher or lower, at times after an extended move on a given direction it will stop moving or pause, some folks will sell and others will buy, if the trend is up and if more buyers overwhelm sellers price will continue moving higher. After all the markets are giant auction houses.
There are some small nuances that you have be aware of that have to be combined at times to get the odds working on your favor every time you put your hard earned money in the markets.
You have to understand how the big funds manage their money and for that you have to find out what trend the stock (you want to tie your future with) is in the monthly and weekly charts.
This link gives you an overall idea of how price cycles from the monthly to the 15 minute chart:
http://chalannn.blogspot.com/2012/08/time-frame-cycles.html
If you are advanced on charting analysis just skip all the links below or comeback some other day and just read the lesson.
After that, if you remain interested in using technical analysis read the lessons on the monthly chart to understand the influence the monthly chart has over the rest of smaller time frames:
http://chalannn.blogspot.com/2014/01/the-monthly-chart.html
http://chalannn.blogspot.com/2014/01/the-monthly-chart-ii.html
http://chalannn.blogspot.com/2014/01/the-monthly-chart-iii.html
http://chalannn.blogspot.com/2014/02/revisiting-some-monthly-charts.html
Now that you understand the importance of a not too extended up trending chart on the monthly chart, if you are interested on entering long inside a pullback you are seeing on the weekly chart read here:
http://chalannn.blogspot.com/2012/08/weekly-and-daily-charts-absorbing-supply.html
http://chalannn.blogspot.com/2012/09/1.html
http://chalannn.blogspot.com/2012/09/will-daily-chart-enter-downtrend.html
Lesson:
Think of it this way, if you wake up in a strange city, the first thing you have to do is find out where you are? To plan how to get back to your normal life.
The volatile market is that strange and maybe dangerous city where you are going to wake up and if you don't understand how to get out of there, it can be very dangerous for you future if you don't find a map to avoid the hidden dangers and this lesson could be that map. Specifically in 2014 The year that dog eats dog.
I'll use three examples where price will signal a move higher using four time frames, from the monthly to the 60 minute chart. At different areas on the monthly chart to illustrate my point.
Using the daily chart as my go to chart for entry on the weekly chart and using the 60 minute chart for a more exact entry, that said some times the smaller time frame TF. Or 60 minute chart will not signal a clear entry, then I'll point to the weekly chart for clues.
The question remains when and where in the chart do you enter the stock your neighbor told you about being the next AAPL.
Can you enter any time and any where on the chart and hope that you were born with the Midas touch?
For the rest of us not born with the Midas touch, if we want to place a trade trying to capitalize on a move higher or going long:
Realizing that price moves in a wave like motion inside normal up trends, forming higher highs and higher lows, we just need to identify the most likely area where price will initiate the next surge higher and enter the long trade.
After we check for some chart nuances that can really help increase our odds of successes if we understand and apply them, such as these:
1: Monthly chart keeps moving higher with small green candles.
2: Weekly chart is preferably in an uptrend beginning another
move higher after a controlled pullback or had a long rest at
resistance and is ready to move higher.
3: The daily chart at a minimum needs to be transitioning with
bias to move higher or in a confirmed up trend. Other
opportunities will present but only if other time frames confirm.
4: Needs to have a controlled pullback of 1/3 off that impulse.
Above and near its rising 20 MA. Forming a higher low
pivot HLP. Or set up bar in the form of a narrow body or
a bottoming tail. Near support. Avoids set ups with big lower
opening gaps. Trigger: Price trades over set up bar.
5: Is the market where the stock I want to trade/ invest
up trending and ready to move higher? Because most stocks
follow the markets they're in. This one is a must have
requirement to be on my list.
For a basic trend analysis, the anatomy of pivot formation click here: http://chalannn.blogspot.com/2012/08/pivot-formation.html
A trend is a very easy diagram to see, price can keep forming an uptrend on its weekly chart like this for years.
Some times that trend changes due to buying exhaustion other times it changes to reflect a fundamental negative change on the business cycle of its company.
In a normal uptrend, ideally you'll like to see a powerful impulse higher, followed by a resting period such as a tight consolidation at the top of the range or a controlled pullback no more than 40% followed by a HLP. And the next impulse higher to make higher highs, followed by another controlled pullback and so on and so forth.
A trend allow us to guess the trajectory of price, we follow that trend and react to it but can't ever predict the future with 100% accuracy, it can change suddenly and at any time.
What can interrupt or change that uptrend? A big violent drop, a 100% retracement of the last impulse followed by a tepid bounce to form a LHP. Signaling weakness from buyers and the possibility of a downtrend will begin to form. # 1 on the chart below.
A big lower opening gap if not closed immediately can damaged the up trending cycles.
Above are the earlier signs of a trend that is about to change, it might change or it might not, depends on its next larger time frame as will be explained lower.
This point in the charts usually offer the trader with knowledge and a trading plan of attack great risk reward trades.
1: Monthly chart keeps moving higher with small green candles.
2: Weekly chart is preferably in an uptrend beginning another
move higher after a controlled pullback or had a long rest at
resistance and is ready to move higher.
3: The daily chart at a minimum needs to be transitioning with
bias to move higher or in a confirmed up trend. Other
opportunities will present but only if other time frames confirm.
4: Needs to have a controlled pullback of 1/3 off that impulse.
Above and near its rising 20 MA. Forming a higher low
pivot HLP. Or set up bar in the form of a narrow body or
a bottoming tail. Near support. Avoids set ups with big lower
opening gaps. Trigger: Price trades over set up bar.
5: Is the market where the stock I want to trade/ invest
up trending and ready to move higher? Because most stocks
follow the markets they're in. This one is a must have
requirement to be on my list.
On the charts below is the clearest example of the list of requirement:
This chart has both larger time frames on the side of a long trade.
1: The daily chart was in an uptrend judging by the rising or R20 MA. Above its R50 MA. But had a pullback that was 60% deep, It did not meet the 1/3 pullback requirement on the list, it needed a different entry strategy. More on that later.
The bounce that followed was weak, formed a lower high pivot and moved lower again.
2: Only to form a HLP. Double bottom to take on the LHP. Closing above it, after that price re established the uptrend again.
Seen on the weekly chart the candlesticks on this TF. Began to narrow, on the next candle, price never dropped anywhere near the low of the previous candle (Like forming steps higher) this is a huge signal as you'll see below.
Entry: The HLP Once formed (red circle) on the daily chart is the best entry, the weekly chart signaled support based on the higher step theory above its rising 10 MA. Exit: Under the two pivots.
On very deep pull backs most everybody will wait for price to bounce and if is weak, price will go lower and if the drop is weak wait for the HLP. To form a double bottom to move price higher.
3: This trade met the requirements on my list of a controlled pullback in an uptrend, above R20 MA. Forms a HLP.
The entry was on the 60 minute chart when it retraced 100% the last drop then consolidated near the top and broke out to establish a new uptrend.
Entry: On the daily chart once you identify the set up bar trade over (red arrow). Exit: Under the set up bar. Two trades long with two different set ups.
This chart EA Has one trade long on the re establishment of its uptrend on the daily chart with trapped shorts for rocket fuel.
Had both the monthly and weekly charts on the side of the longs.
1: The daily chart was in transition with lower bias only needing one more lower high and one more lower low to establish a new down trend, on a Friday it had a big higher opening gap igniting a massive short covering rally and closing above two pivots, turning the weekly chart into a big green double bottom candle.
2: It went from transitioning with bias lower to transitioning with bias higher to re establish its uptrend, on a single day.
Next few days it had a controlled pullback that met my list of requirements from the monthly chart to the daily chart.
3: On the 60 minute chart the only signal it gave to enter was a HLP. Typical of very strong stocks, after that the move higher was very controlled and kept forming HLs. and the uptrend in place.
Entry: Once the set up bar was traded over (red arrow) confirmed with the narrow body on the weekly chart and the fact that the daily chart has no resistance overhead seen on its weekly chart.
Exit: Under the set up bar or HLP. Later.
NUGT Offered two or more of the best opportunities to make money on the long side during the month of December but catching falling knives requires knowledge of price behavior:
The monthly and weekly charts were on a sure downtrend, when you see the monthly chart like this the best thing to do is wait for a very narrow bar to signal that volatility has ended.
The volatility was huge as bottoming processes always are, price was bouncing in a 5$ range so the hourly chart did not help on this example, back to the weekly chart to look for signals.
The strongest signal for a reversal needed the monthly chart forming the smallest candle at the bottom. And when both the weekly and daily chart formed their first higher low together.
Lets analyze it:
1: The daily chart remained in a downtrend indicated by the declining 20 MA. And the LHPs forming under it. The next bounce retraced nearly 80% the drop and pulled back as it should in a DT.
2: Formed a HL. On the weekly chart as price held above the previous low.
3: Following the potent bounce the pull back was controlled and did not break the previous
4: Next day it opened with a higher opening gap closing above two LHPs. Totally putting the shorts on notice that something big had happened, the pullback back to support met my list for entry long:
5: The set up bar was the red bar and the entry was immediately after the higher opening gap (red arrow) inside a transition with bias higher, two days later price closed above a previous high and established its uptrend UT. Usually the pullback is buy able in an UT.
Exit was the low of the set up bar.
There you have it. Strategically looking for high reward low risk entries inside the trend and it work for shorting as well.
I which I had read this lesson 15 years ago.
******Print some charts, FIRST analyze them, then paper trade them and see how they work for you.*****
For the second part of this lesson with 5 more different long setups click here: http://chalannn.blogspot.com/2014/02/finding-trades-at-specific-areas-inside_3.html
If this lesson doesn't make any sense to you, read the first ten lessons on this blog, because they explain in detail the method I use to analyze any stock in any market.
Feel free to leave a comment.
All charts were created with FreeStockChats.com and Scottrade Elite.
I keep writing these lessons because regular folks are
getting trapped inside these very complex trades, that required
understanding and planning, without both the odds are high you will lose money.
Over the years I've saved and studied 1000s
of charts and this is the gist of it.
Will reading these lessons help your
trading? I think so.
Will these lessons help you
master the
markets? Yes, if you have the time it requires to implement every step,
in a few short years you'll uncover some key nuances that were omitted
or not emphasized on the lessons.
Part 1: Shorting climax, it's more technical in the analysis:
http://chalannn.blogspot.com/2014/03/anatomy-of-climactic-setup-with-clues.html
Part III: Apparent capitulation patterns that weren't:
http://chalannn.blogspot.com/2014/10/capitualtion-patterns-that-behaved.html
Part II tries to analyze the action from the psychological side but still full of charts.
There's risk trading these strategies but bigger rewards await the one with a plan to capitalize on them.
Print some charts that you think match both examples and learn the nuances of this capitulation trade on both directions, study and test them before risking your hard earned money on them.
IMO This is the best way to enter stocks in a clear downtrend or to short stocks inside a final parabolic surge. Both trades can be very profitable if executed at the right time but require strict rules that have to be met to qualify the pattern as parabolic with climax
volume exhaustion.
Alan Farley wrote once that price has elasticity and he was right. If price doesn't bounce fast and large within in a few days following capitulation or drops hard and fast following buying exhausting climax be careful because there might be big reasons why big funds are not seeing value and the odds increase with time of another move on the prevailing direction once the big move has been digested. Part III Of the climax lessons gets more in depth on this subject.
Just because you see some stocks higher 20, 40% or 100% Away from their rising 20 MAs on their daily charts or any other time frame, that doesn't make them climactic.
They are moving in a parabolic way but the odds are low they will have a 10-40% drop in a few days as explained in part 1 Anatomy of a climactic trade.
Parabolic moves do drop to their rising 20 MAs but it's a slower and different process.
Parabolic moves without climax offer very profitable short trades if you are patient and willing to wait for the right entry signals, most of the time these pattern will trigger differently, in the form of a 1 Final climax surge. 2 A surprise lower opening gap. 3 A lower high LH Or 2X Top formation. 4 An unexpected violent drop on their daily charts to "encourage" longs to sell fast, after that we must find short entries IF IF IF the bounce is weak.
Using four different time frames I can identify exhaustion volume during the first 30 minutes. This charting program ends the 1st hour at 10 AM EST.
What makes an extended stock climactic is the buying exhaustion that happens at a specific area in the chart described below, it takes place because some participants don't understand that the markets are an auction, large and fast moves need to be digested as early buyers get out having to be replaced by new holders, shorts know this and try to capitalize on the possible quick drop and that battle for the share imbalance takes time.
Most of the time a stock that just doubled in price in a few short days, usually take weeks to move higher again, if at all after a controlled long base.
Or a stock has moved 20% In a few days, enticing new longs thinking that said stock can move another 20% without a long resting period.
Or folks reading on message boards about a possible buyout will quadruple the price of XYZ And they buy it with reckless abandon, of course rumored buyouts rarely take place trapping almost every one willing to make a quick buck fast without a prudent stop lose.
All the above combined with trapped shorts needing to cover their bad entries, all create a huge buying imbalance that when it ends it sucks in all the buyers leaving nothing but sellers.
Inside the auction for every buyer there is a seller but not at the same price, if a large sell order needs to be filled with little or no willing buyers price will move lower until it gets filled, imagine the price vacuum it creates in area where there isn't obvious support technically from where price could bounce.
I'm talking about buying exhaustion from speculation, anticipating much higher prices fast when the forces will push price lower due to the imbalance.
If
a new drug becomes the cure for cancer then the sky is the limit on its
stock's price as sales will multiply over night, this is a very
different scenario. More on that at the bottom of this lesson.
Capitulation at the bottom.
These
long trades work most of the time because the massive selling exhausting volume forces
all the sellers out thus forcing most professional shorts to cover, price bounces hard because it
has little resistance as the move to the downside was fast and fluid, on the way down it had a cascading lower effect that has no resistance on the way up when price begins to bounce.
Buying inside climax or after the first bounce already occurred, measuring both the buying and selling intensity to find a safe entry, once the first wave of profit takers are out.
For this trade to work I'm looking for the biggest red
candle with the biggest volume bar on the daily chart and it usually
happens after multiple days lower, it has one massive final drop either
by a lower open gap or a big red candle < 20 to 40% Away from its
declining 20 MA On its daily chart.
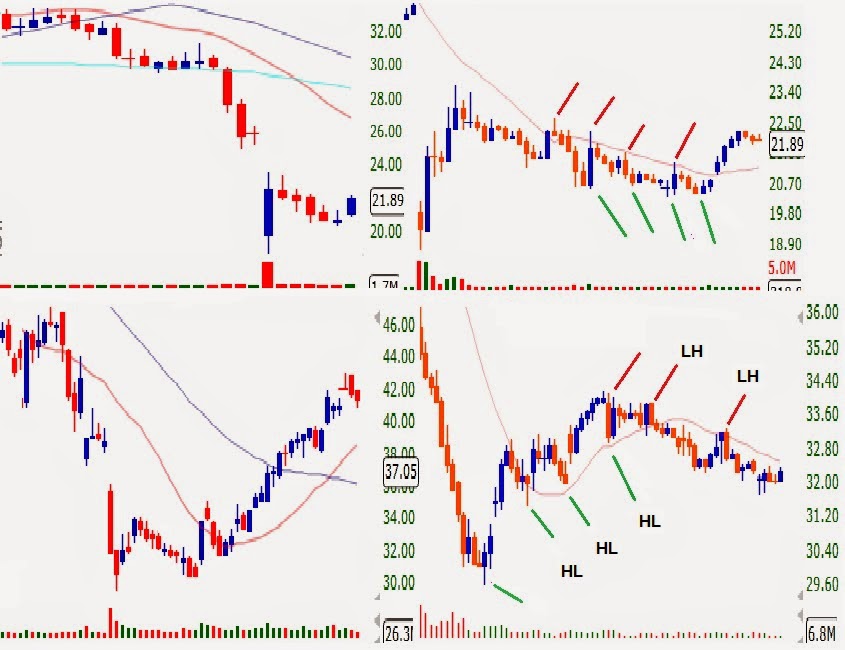
The
chart on the top half has SRPT 7 days ago, it formed a climactic bottom
with a lower open gap after multiple days down, the lower gap got buyers
eager to buy at the open, forming a good size green candle on massive
volume that had no follow through next day.
Follow
through or continuation higher the very next day is extremely
important, a flat open, higher or lower opening gap will test the
commitment of all, if it was a great buying opportunity the day before
and it opens lower new buyers should step in fast and close the gap
because if that don't happen day traders will get out immediately,
sending the stock lower, giving pause to potential buyers on the
sidelines to wait for lower prices sending the stock much lower, which
is a good thing because it removes potential sellers at higher prices,
only solid hands will remain holding new shares, once all sellers are
out, little buying will form a new higher low bounce on the daily
chart.
It took 5 days and a 50% controlled retracement to shake most sellers out.
Amateurs
will think that the stock will make new lows but after the massive
capitulation volume days earlier there aren't enough sellers for the
stock to make new lows because lots of new bargain hunters and investors
bought cheap the day it formed the green candle after the gap, once
some potential buyers realized that no new lows were made a little
buying took it higher six days later.
Lower half TWTR Had a similar climactic pattern but this one had follow through next day and in fact bounced higher for a few days, once it began forming lower highs on the 60 minute chart day traders got out, TWTR Took 12 days of controlled selling until it found buyers and once the higher low was identified it had a huge up day that sent a warning to all shorts that big money was getting long. TWTR Eventually bounced 30% higher.
Disclaimer: Shorting stocks require deep knowledge and a solid trading plan with solid stops in case it moves against you. Recommended only for the seasoned in the markets.
Always keep this in mind. EXTREMELY IMPORTANT.
The
other two lessons on shorting parabolic climactic exhaustion, described
the momentum chasing crowd creating a big buying imbalance that can
last for weeks until the stock reaches buying exhaustion, from pure
speculation at the time when some forces are signaling a move in price
in the opposite direction due to the share imbalance.
BUT.... There is always a but.
If
a drug maker discovers the cure for cancer (Or hazmat suit makers as was the case lately for their manufactures LAKE and APT), then the sky is the limit on its
stock's price as sales will multiply over night, this is a very
different scenario.
Even then at some point
most of the good news will be priced in but at a much higher price than
most expect, utilizing these charting techniques to identify tops can help you stay ahead of the masses.
Know this: The higher the % of separation of price versus
its raising 20 MA On its daily chart the more attention you have to pay
on your long holdings, instead of buying more you should be thinking
about selling some.
Shorting parabolic moves require the same criteria as capitulation bottoms but in reverse.
The climactic exhaustion pattern requires the stock be moving higher multiple days and on the day I'm looking to find my short entry it has to form the biggest green candle with the biggest volume bar not only on its daily chart but also in the 15 and/or 60 minute charts, if price is at or near resistance on the weekly chart even better.
Once I see those requirement fulfilled, I have to assume that all buyers that wanted to buy already have bought, and all shorts that needed to cover did so already, so gravity, lack of buyers, professional shorts smelling blood, new longs realizing they are late and by now trapped or about to be, they all react at the same time inside a price vacuum with out support usually collapse price and fast.
The dip buyers will buy the dip but this time the stock will have a weak bounce if at all turning them into more selling fuel or new unhappy investors.
Why would you want to buy and hold the dip following climax other than a quick day trade at an area of a possible technical bounce, when mostly sellers control the future direction?
The chart below shows
DDD. After 4 green days, the 5th day just took off, at one
point during the day the stock was 15% Higher, it hit 70$, at that price it
was 30% Away from its rising 20 MA. On its daily chart but what got my
attention was the volume forming on the third hour with the biggest
green candle on that time frame and the next volume bar was as big and
red creating the climax.
When you see a
massive green bar with massive volume after multiple green candles on
the same direction, ask yourself who will buy the stock higher from the
last buyers? NO ONE.
VJET Below on the same day with very
similar pattern, the intra day pullback on this stock the day of the
parabolic top wasn't as violent but volume was climactic, so with all
long buyers committed and without fresh new buyers, that created a selling
vacuum that took six days to find some buyers for a technical bounced but
it was weak turning lower continuing more selling.
Below USU Had the same parabolic characteristics, early on
the second green day it had quadrupled in price, some folks were
screaming for even more gains after that. I warned them of a climactic
parabolic move happening at 12$ when I saw the massive volume bar on the
60 minute chart during the 1st hour.
Ask
yourself this simple question: Who is going to buy from you if you
entered near the top after the massive buying that already took place?
The only legit answer is the company being bought by another one, but
other than that?
Price dropped 25% Or 3$ to
9$ in the next two hours and I posted on Stocktwits: "If you are under
water and the bounce makes you even GTFO"
Because the dip buyers always buy the first drop after a new high and technically the 60 minute chart was in an uptrend but climactic. After violent drops the odds are high of a bounce but weaker and only to form a pivot lower.
USU Bounced the rest of the day only to form a lower high pivot on its 60 min. Chart. Putting the uptrend in question on that time frame. Remember it was so extended on its daily chart after it had quadrupled with exhaustion volume no less.
The chart was screaming trouble for longs and I posted such.
Next day it opened with a lower open gap triggering a stampede of longs that recognized the hourly 2X Top trouble.
The chart below shows a similar 2X Top on the hourly chart that triggered a massive sell off on USU A year earlier.
Look at the separation of price versus its rising 20 MA On its daily chart on massive volume but more importantly the 60 minute chart formed a 2X Top on climax volume putting the uptrend in question.
Next day it opened with a lower opening gap and that ignited the selling because there weren't enough buyers to support price inside gravity, dip buyers that bought the drops were punished if they didn't sell fast.
This chart shows what happened some days latter following the exhaustion moves.
One day wonders?
These are not regular B/Os of 20 or 30% in a day but moves of <70% up moves in one day.
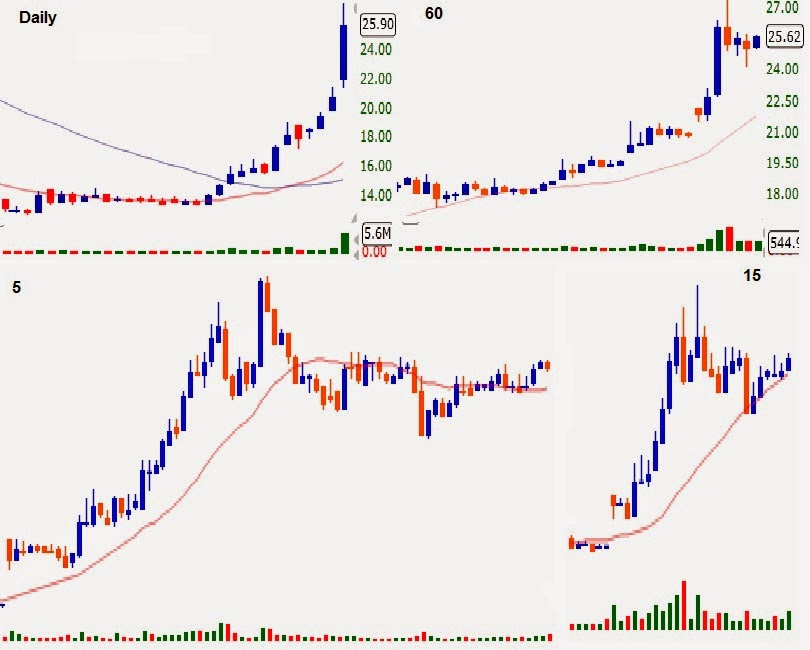
Same requirements apply to these possible exhaustion short set ups. Massive volume on the 5, 15 and 60 minute charts following the extended move, if possible the biggest green candle with the biggest volume on the 60 minute chart to signal exhaustion. After that price needs to drop fast, if it bases tightly it could continue moving higher, after all this is only the first day of the B/O.
The deeper the pullback the more bearish the daily candle will look as seen on the charts below.
For a continuation higher next day price needs to form a tight long base, hold the upper 1/3 -1/4 the rest of day and B/O Higher again next day.
On the chart above of IVAN It didn't have the massive price expanding candle that usually signals the end the move nears on any of its intra-day time frames.
Price got far away from its raising 20 MA On the 60 min. Chart.
But the biggest volume bar highlighted on the 5 and 60 minute charts signaled the buying exhaustion, shorts and seller sent price lower after that, slower but the result was the same by the end of day.
On the chart above: Exhaustion volume on the 60 minute chart will stop a big move, what follows after that depends on how the longs feel about holding longer, depending on some factors such as price making all time highs, near resistance, time of day, length of rally Etc. Etc.
The chart on the left shows the exhaustion volume on the 4th hour (during lunch) the pullback was controlled, two candles later the bulls tried to make new highs but buyers had exhausted earlier remember? After that price fell under its own weight. It formed a 2X top on the 15 minute chart sending a strong signal the big move was over.
Mostly sellers left overwhelmed the small buying.
The chart on the right shows climax volume near a previous top, the ensuing hard pullback explains that some longs were trapped on the previous exhaustion surge that happened the day before, and were happy to get out near break even. See the 2X top marked blue.
The black line separates yesterday and today's action.
***For price to keep moving higher the pullbacks have to be controlled, followed by more potent buying to keep making new highs on ever increasing volume until that exhausts = Climax.
TO BE CLEAR: If you see massive volume on the hourly chart after multiple green price candles, specially near resistance then shorting the stock is the best odds play. BUT BUT BUT. Did i mentioned BUT? If the volume occurs after only one big green solid candle you have to look for entry on the long side because its a new move to the upside specially after a long basing period.
Inside the auction anything is
possible, the reason I always use stops is because even after exhaustion
volume, if the stock doesn't drop hard but bases instead, it can
continue moving higher after a decent basing period creating another
short squeeze from professionals who shorted this well known
pattern.
Shorting
parabolic climactic stocks puts very high odds on the side of the
shorts but there isn't a 100% Guarantee that 10 out of 10 will work.
Some trades need more than one entry. The odds are
very high that price will drop hard and fast BUT, BUT, BUT 2 in 10 will not, they will have a controlled pullback, base and move higher one more time.
If I said 8 Out of 10 work. What about the other 2 you ask?
I recommend using stops all the time.
You
can't fight the power of the obvious strength when longs don't want to
sell, if price doesn't collapse as explained on the previous lesson
using PLUG And TWTR. If price bases instead of collapsing you have to cover your short fast because the odds increase with time of another short squeeze as seen on the chart below:

On the next chart on this day I posted a short trade on Stocktwits during the first 30 minute at 9.80$
But why? The answer is in this lesson.
Few weeks later on DGLY And ISNS:
If you are planning risking your money on these lottery tickets at least have a planned exit or be turned into a long term "investor".
Always buy the breakout never chase fast moving price, the odds are highly against you.
Tip: If you are not familiar with price reading using
triangles and other geometrical shapes, learn it, the behavior of
triangles on the charts, be it descending, ascending or symmetrical will help
you greatly to understand supply, demand relation and analysis.
Very important: The bigger the bounce the bigger the commitment from big holders as seen on the chart below:
If the bounce is weak big $$$ Not fully behind it.
There are many in depth technical analysis lesson explained as simple as possible on the first pages.
Feel free to read them and learn from them before they are gone.
If you have any question or comment feel free to post.
A
ll charts were created with Scosttrade's Elite.