Sometimes after a drop lasting multiple weeks to support, I look for the conventional clues to find entry, such as waiting to enter after a weak technical bounce that I've seen in the past will reverse to test that low and the commitment of the new longs, and if said reversal is controlled, forms a higher low and gives me the signal that sellers are exhausted, I usually take the trade to capitalize on the highly probable stronger bounce.
But what if the higher low bounce is weak, unable to close above the first peak or lower high pivot (LHP). Forms a double top and collapses again taking my stop and dreams of riches with it.
Blame it on the monthly chart.
I mentioned before that as long as the smaller time frame keeps moving lower the larger time frame will follow it and viceversa. Lets go in more depth, this is one scenario but gives us an idea of how trends or volatility on larger time frames affect the smaller ones and viceversa.
You have to understand trend pivot formation to understand this lesson, Please click here for that lesson:
http://chalannn.blogspot.com/2012/08/pivot-formation.html
A technical bounce is a necessary bounce to release some oversold pressure after a big drop, where the odds highly favor continuation of the trend unless some conditions are met, such as a powerful bounce or the bounce begins closing above lower high pivots.
The color boxes pretend to enclosed the activity like a X Ray into a given time period simultaneously.

1: A bear Flag was forming on the monthly chart, price formed a lower high pivot (Black arrow). Seen through the weekly chart, by the time the second purple arrow or lower high pivot (LHP) Formed, price was in a downtrend (DT) Under its declining 10 MA.
2: The action was forming a descending triangle.
3: LHPs (Purple arrows) kept forming and kept sending price back to support.
4: every time a higher low formed the ensuing bounce was weak signaling that there weren't big buyers to push price over resistance and/or close above a lower high pivot (LHP) To signal a solid bounce in the near future.
5: The last bounce looked weak and price collapsed the bottom of the descending triangle with an expanding red bar on both time frames. After that the weekly candles narrowed but price couldn't bounce because the monthly chart kept expanding lower thus pushing them lower.
6: By the fourth red bar on the monthly chart price finally stopped going lower, seen through the weekly chart price formed a double bottom, then a W bottom, then it broke down took stops, bounced back to the top of the range into a triple top, but price wasn't able to break out and close above a LHP. Not even once.
This action took a few months to develop and once in an attempt to breakout that failed, it formed a LHP. On the monthly chart (Black arrow).
If you've read my previous lessons you must have an idea of what would happen if that LHP. Wasn't nullified.
On the weekly chart next to #6 buyers had control of price, consolidating it for nearly six weeks at the top of the base but weren't able to break out of that quadruple top and price began to expand lower, collapsing that long base, basically wasting it.
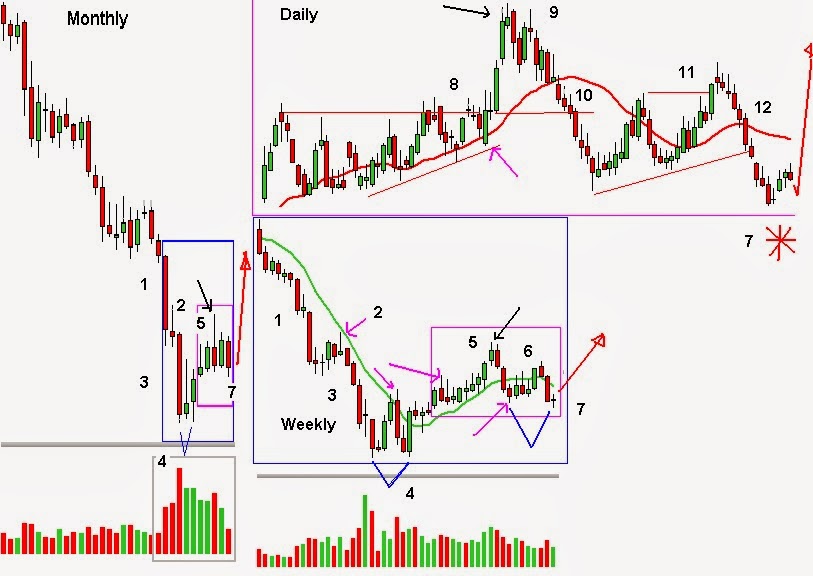
1: Price collapsed again, seen through the monthly chart the candlestick began to expand (third red bar) On the weekly chart next to #1 it formed a narrow green body signaling that selling was decreasing but the next bar expanded red again, why you ask? Because that contraction of volatility happened in the middle of the expanding monthly candle that was falling under its own weight.
2: The big red expanding bar on the monthly chart finally ended giving the longs a rest, the weekly chart began healing, finding equilibrium between buyers and sellers. It had a technical bounce but only to form a LHP. Near its declining 10 MA. You have to know by now what follows after a LHP. Forms.
3: Exactly, the monthly chart did not form a bullish candle so it began to expand again but this time on capitulation volume.
4: Once the last long capitulated, buyers forced a technical bounce with ease to its D10 MA. Where it formed a LHP. And returned to test the low, where more buyers got in forming a double bottom (just analyze the size of that HL Green bar for clues about the commitment of the new buyers) Thus sending price above its flat to rising 10 MA.
5: Price kept riding the R10 MA. And eventually establishing an uptrend on the weekly chart, after that price collapsed again. Why?
The most obvious one is that it reached resistance at #2 and some folks trapped on the collapse to the left were able to sell, another one is that the bounce on the weekly was 50% the drop on the monthly chart, maybe needed more time to fix the massive drop. IMO the bounce was a technical bounce on the monthly chart to form a LHP. Combined with the other three.
Remember that the best way to anticipate what price will do next is to follow the formation of the next pivot, either another LHP. To keep going lower or a HLP. To challenge the last LHP.
6: Then price bounced again but was weak and looked ready to head lower again and it might.
7: It has a big drop on the daily chart, a narrow range body and possible double bottom on the weekly chart but most importantly what is that forming on the monthly chart? More on this later.
Daily chart:
8: It broke out all that resistance the way the weekly chart couldn't to ignite a bounce on the monthly chart on the previous chart. this breakout ignited a big move on the weekly chart that led to the set up bar (Possible LHP) On the monthly chart.
9: The daily chart was in an uptrend but a lower high 2X top sent price lower.
10: Since the monthly chart was in control, the pullback on the daily chart went under its rising 20 MA. And kept slicing through solid support until it stopped under it.
Had a technical bounce followed by a small reversal, formed a HL.
11: Price moved higher again, even closed above the LHP. Ending the DT. And putting the trend in a transition state from sideways to uptrend?
It needed one more higher low and higher high to establish its new uptrend so the pullback should had been buy able right?
12: If the monthly and weekly charts were in an uptrend then normally the rising 20 MA. Will be the area where price should stop going down, form a HLP. And begin the next cycle higher but not this time, price sliced through two HLPs destroying the hopes of the longs.
Why all this crazy action? Because the monthly chart is in control of price and is trying to form a set up bar and eventually will form a HLP. To begin moving higher.
How do I know? 1: The capitulation volume eight months ago.
2: The narrow range body on the weekly chart forming a possible double bottom and if it that double bottom sends price higher it will form a bottoming tail on the monthly chart that when tested next month it will not go lower giving longs enough time to form the HLP. To keep moving it much higher by summer.
3: The fact that it retraced 100% the last drop (Double bottom to #2) And the pullback even though it looks deep still holding close to 50% makes me bullish on my theory that the big drop was to form the set up bar on the monthly chart.
The stock is WLT On the closing week of 1/17/2014.
Only time will tell.
Time did tell. Read the follow up:
http://chalannn.blogspot.com/2014/01/monthly-chart-follow-up.html

Another one that had some crazy action on the weekly chart until the monthly chart finally stabilized and was able to begin forming a possible double bottom.

And then there is this one: If a picture is worth a thousand words, you figure this beauty out and your trading and/or investing will get much, much better.
Click here for the follow up to this lesson:
http://chalannn.blogspot.com/2014/01/monthly-chart-follow-up.html
Lesson#8: http://chalannn.blogspot.com/2014/01/the-monthly-chart-ii.html
For another lesson on how time frames cycle:
http://chalannn.blogspot.com/2012/08/time-frame-cycles-from-monthly-to-15.html
I hope that you learned something valuable.
Feel free to leave a comment.
All chart were created with Scottrade Elite.
No comments:
Post a Comment