I keep writing these lessons because regular folks are getting trapped inside these very complex trades, that require good understanding and planning or you will lose money.
Part 1: Shorting climax, it's more technical in the analysis:
http://chalannn.blogspot.com/2014/03/anatomy-of-climactic-setup-with-clues.html
Part II: On climax and capitulation trades:
http://chalannn.blogspot.com/2014/01/finding-trades-before-new-trend-gets.html
The markets are always challenging us, they are very dynamic and we have to change with them, some times I try to over simplify the process too much and forget price discovery happens through the auction.
Inside the auction nothing is written in stone, if XYZ Is going through capitulation it will exhaust all sellers but if after that there are no interested buyers that believe XYZ Is a bargain to be had at a fire sale price, XYZ Will bounce tepidly to release oversold pressure, or just digest the drop with a flat base and will keep moving lower once the last hopeful longs realize the big funds are not buying it, Look at the daily chart of WLT from the beginning of 2014 to the present to get an idea of what I'm talking about.
The same goes for stocks moving higher:
The chart below shows another climactic parabolic move in the making or so I thought.
The daily chart of LAKE Was expanding mid-day, 12:35 EST. To be exact.
The 60 minute chart shows the third candle being the biggest size and volume wise, the fourth just beginning to form.

At the exact 12th 5 minute candle (red arrow) it formed a LH textbook short entry because the first high was on massive volume and the next bar had even bigger selling volume, the 15 minute chart shows also the biggest red volume bar.
My criteria to go short at that level was that there was no way longs could gather enough volume to make new highs during lunch time after three big candles on the 60 minute chart, I will get at a minimum some profit taking pull back or at best a big drop into the void.
1- LAKE Formed its first high on the biggest volume bar, on the next bar big sellers showed up. It pulled back a little enough to form a HL Pivot and bounced back to the high on weak volume to form the first LH. 2- Highlights where the last chart ended and where the short was entered, the LH Sent price lower under the last HL Pivot seen on the 5 minute chart. 3- The 5 minute chart lost the uptrend, now trend less on that TF.
4- Price formed a small base and began to move higher as it became clear to all that the pullback was very shallow to pivot higher or form a HL Pivot on the 15 minute chart, closing the hourly candle with a bottoming tail #3.

5- The HL Pivot on the 15 minute chart did its job, kept the up trend alive enough to make new highs on light volume, after that, price just based the rest of the day near the top of its range. 6- Next day it opened with a higher open gap.
The first top formed on big volume, that didn't scare the longs enough to force them to sell, normal price cycle behavior took over, on weaker volume mind you but it made new highs. Hard to believe but is in the chart.
What would have kept me in the short trade? Once the HL Pivot formed on the 15 minute chart it signaled that the top was going to be challenged so I had to cover, if price stopped near the highs and formed a LH On that TF. The same way it happened on the 5 minute chart earlier then that could had been a great shorting signal that price is rolling over on the larger time frames, once price made new highs there was no short trade because as long as the 15 minute chart keeps making new highs, the 60 and daily charts will keep moving higher as was explained in detail on the previous two lessons with links on top of this lesson.
How will LAKE Top out? Look for a double top on the 60 minute chart and a violent pullback to shock the bulls or wait for the 15 minute chart to enter in a downtrend first.
I'll post the chart.
Rule #1 Don't ignored the message price action is sending you, if the stock you are short is not collapsing after reaching buying exhaustion don't fight the obvious strength, wait for other stronger signals, such as LHs or 2X Tops on the 60 minute chart or even better on the daily chart, will increase the chances for short trade to succeeded.
Understanding herd mentality helps you anticipate how they will react in a few ways that you recognize after they reached exhaustion, to try to capitalize by taking the other side of the trade, but on some occasions the behavior of the masses become very unpredictable even after reaching obvious exhaustion due to outside forces such as favorable headlines that keep feeding the short squeeze, or takeover rumors that keep levitating price to much higher levels to the surprise of all.
And vice-versa, prices can reach obvious capitulation stages confirmed by price action and volume yet a bad headline can keep influencing price lower, such as a collapsing stock in the same sector or correcting markets.
If you have a position on a stock because you recognize the patterns with a high probability pay off such as shorting parabolic moves inside climax as explained on the lessons above or buying right after capitulation and the trade turns against you, you must rely on some form of insurance to get you out of trouble with minimal damage. Also known as stops.
Basically trade what you see not what you think will happen and get out fast if the action proves your analysis wrong. The market is always right.
Edit 10/18/14: Always keep this in mind. EXTREMELY IMPORTANT.
The previous two lessons on shorting parabolic climactic exhaustion, described the momentum chasing crowd creating a big buying imbalance that can last for weeks until the stock reaches buying exhaustion, from pure speculation at the time when some forces are signaling a move in price in the opposite direction will happen due to the share imbalance.
BUT.... There is always a but.
If a drug maker discovers the cure for cancer (Or hazmat suit makers as was the case lately for their manufactures LAKE and APT), then the sky is the limit on its stock's price as sales will multiply over night, this is a very different scenario.
Even then at some point most of the good news will be priced in, but at a much higher price than most expect, utilizing these charting techniques to identify tops can help you stay ahead of the masses.
Last week I ended the explanation of the chart on LAKE With this paragraph:
How will LAKE Top out? Look for a double top on the 60 minute chart and a violent pullback to shock the bulls or wait for the 15 minute chart to enter in a downtrend first.
I'll post the chart.
LAKE Kept moving higher from 17$ To 30$ On the next two days, of note was that it nearly doubled in price on light volume compared with the volume it had two days earlier where it looked like volume reached exhaustion, I posted few days ago that longs were not selling because they were expecting a much higher price and they got it.
On the last green day on the daily chart, the last hour formed the biggest 60 minute candle forming the first top.
As seen on the 60 minute chart the next day it opened with a lower open gap, price dropped violently for 30 minutes, LAKE Immediately bounced as soon as it touched its rising 20 MA. The bounce was very potent but couldn't make new highs forming a double top and putting the uptrend in question on that time frame sending a big warning to all.

But after forming the 2X Top, that put the up trend in question, price dropped to the bottom of the range, formed a base on the lower half of the range, long enough to form two lower high pivots on the hourly chart, the daily chart was so far away from its rising 20 MA. That gravity took hold of price, sellers overwhelmed the little buying that was left and price kept dropping after that.
Volume by itself is a very big signal of possibly incoming change but you still need supporting patterns like the 2X Top on the 60 minute chart that will influence the daily chart to react.
Once the lower high pivots formed on the hourly chart LAKE Begun to drop, the favorable headlines kept coming for the Hazmat suit makers but price kept falling because at some point most headlines get priced in. As long as price keeps forming lower high pivots on this time frame the downtrend will continue pulling the daily chart lower, until it forms a base beginning with a higher low to signal the end of the selling.
Heavy ignition volume after a break out from a long base is very positive, but massive volume following an extended move, usually ends said move 9 out of 10 times.
Price might not collapse, it could form a base and maybe make one last new weak high and fall back, but for price to almost double after an extended move on massive volume, without a long base on noticeable lighter volume is very rare IMO. Of 17 years doing this.
On APT The massive red selling volume the day of the top exhausted all the buying and left sellers in charge, every time longs wanted to push price higher they failed, once the lower high pivot formed on the 60 minute chart signaling that the smart money was out and not coming back price collapse.
I posted on StockTwits the day after the massive selling volume, warning folks that wanted to initiate new longs to have tight stops because sellers looked in charge simply based on this volume analysis, and the pattern was also on the side of sellers and shorts.

Never buy inside a price falling vacuum even if you use the averaging down technique, Even if you get it right some times, odds are high you'll lose it all gambling this way. Have a solid entry and exit plan of attack using clear patterns in the charts.
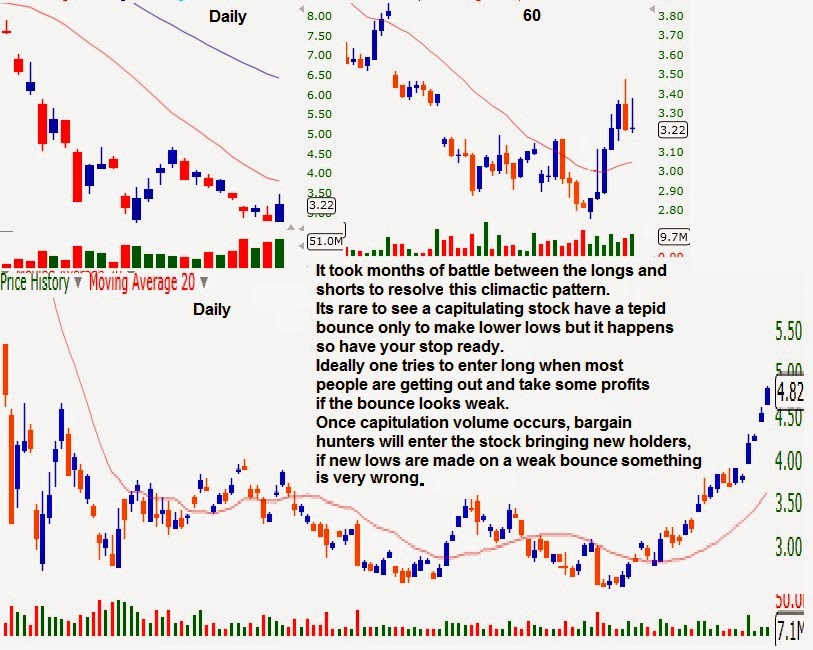
This is DGAZ ETF A Velocity Shares 3X Inverse Natural Gas ETN linked to the S&P GSCI Natural Gas INdex Excess Return. It's coupled to natural gas futures betting that price of natural gas will fall, coming from a very cold winter in the year of our Lord 2014. Natural gas kept rising late in the Winter and early Spring so this ETF Kept falling.
Rule #2 Be extremely familiar with the stuff you are trading.

On the last drop it fell from 8.40$ To 4.80$ 4 days ago on noticeable big selling volume. My rules of entry on a climactic trade were met by most of my requirements. Expanding red candle after multiple red days on massive volume, very far away from its declining 20 MA. On its daily chart.
So I entered on the higher opening gap the next day, seen through the 60 minute chart it bounced but stopped under its declining 20 MA. Pulled back a little bit and tried to break out but failed instead forming a lower high Pivot.
LH Pivots signal the computer will send price back to the prevailing trend if not nullified: The trend was lower. it kept falling next day.
Rule #3 Don't hold your long if the bounce is weak forms a LH Pivot, and drops like a rock threatening to take the climax lows because the odds are high price will drop much lower.
Because if it drops again and takes some stops, price will make new lows trapping everyone that tried to catch the falling knife and didn't use stops.
Price collapsed again dropping from 5.40$ to 3.30$ a massive 40% on top of what it lost on the drop from 10.20$. Now is much cheaper and the drop happened to form the biggest red candle on even more volume, good entry right? All sellers must be out by now. Lets see.
Next day seen through the 60 minute chart DGAZ Opened with a higher open gap. market makers dropped price a bit to test the commitment of the new bulls, weak hands got out DGAZ Moved higher the rest of the day recouping 1/2 of the red candle on good buying volume, next day price kept moving higher to the top of the big red candle, but on the closing hours price dropped forming sort of a topping tail.

Next day DGAZ Formed a narrow body on the daily chart signaling odds were high of price moving lower to form a HL 2X Bottom, because judging the selling volume three days before everyone that wanted to get out, got out right?
A lower open gap out of the blue puts every one that bought the previous three days under water and naturally ignites more selling as seen on the last volume bar. DGAZ Closed with a lower low re establishing the downtrend on that time frame.
The lower open gap next day found stronger buyers igniting a four day bounce to the top of the range. Six days later price was back to the bottom again.
Some time cheap keeps getting cheaper for a reason. I learned my lesson the hard way through the years and lately trading DGAZ, NUGT.
Other examples below:
WLT Daily chart shows two days where volume was very heavy on the selling side after losing nearly half its price, no bounce.
The day of the asterisk it had a higher opening gap and moved higher for exactly 30 minutes as seen on the first candle on the 60 minute chart, sellers immediately came, I know because I went long on the second red candle but the pullback was deep and the ensuing bounce was very weak closing with a topping tail on the daily candle forming a set up bar that if completed three days later it was going to be a lower high pivot.
The hourly chart kept forming lower high pivots pushing the daily candles lower.

Exxi dropped 50% in a few short months and on this day it dropped 20% in a single day, on the hourly chart you can see the acceleration of volume and the bargain hunters scoop it near 8$ for very potent bounce to close with an awesome bottoming tail on the daily chart.
If it opened flat next day one needed to find entry on the weak drop because it looked like buyers were going to line up to buy this bounce. Just look at the massive buying volume on the daily chart, it looked like very big funds were in control of the stock right?
If it had a higher open gap then one had wait until the pullback happened on the daily chart to form HL Where every one could enter at a better price.

Next day EXXI opened with a lower open gap and kept falling and falling, lost 2/3 of the big bounce from the day before and couldn't find buyers, not until it reached 100% retracement it tried to bounce only to form a LH Pivot as seen on the 15 minute chart to keep moving lower and closing below the awesome bottoming tail the previous day.
I had to do a double take on this one because I didn't believe it myself what looked like big holders the prior day didn't defend it the next day.

On the next day it formed a narrow body, now looks like everyone that wanted to sell did and looks ready to bounce. To be fair the mother ship SPY ETF Got pummeled on the last two days as shown on its daily chart pulling every stock lower with it.
EXXI probably will bounce hard enough to have a controlled pullback to form a HL And move back to 11$

LINE Had a text book entry: On this day it was forming the biggest red candle after multiple red bars on the same direction.

You can see on the 5, 15 and 60 minute charts the biggest expanding bar on the biggest volume, sellers exhausted and then the narrows body on the 15 minute chart gave the awesome entry with the stop 20 cents under low of day, the green volume began to signal professional bargain hunters were stepping in and drove price higher.
IMO 7 out of 10 climactic plays work on the other three be ready to use stops.
I hope you learned something valuable.
Feel free to leave a comment.
All charts are source www.FreeStockCharts.com

